Overview
PlanetScale Insights continuously analyzes your query performance to establish a baseline for expected performance. When a high enough percentage of queries are running more slowly than the baseline expectation, we call this an anomaly.Using the Anomalies graph
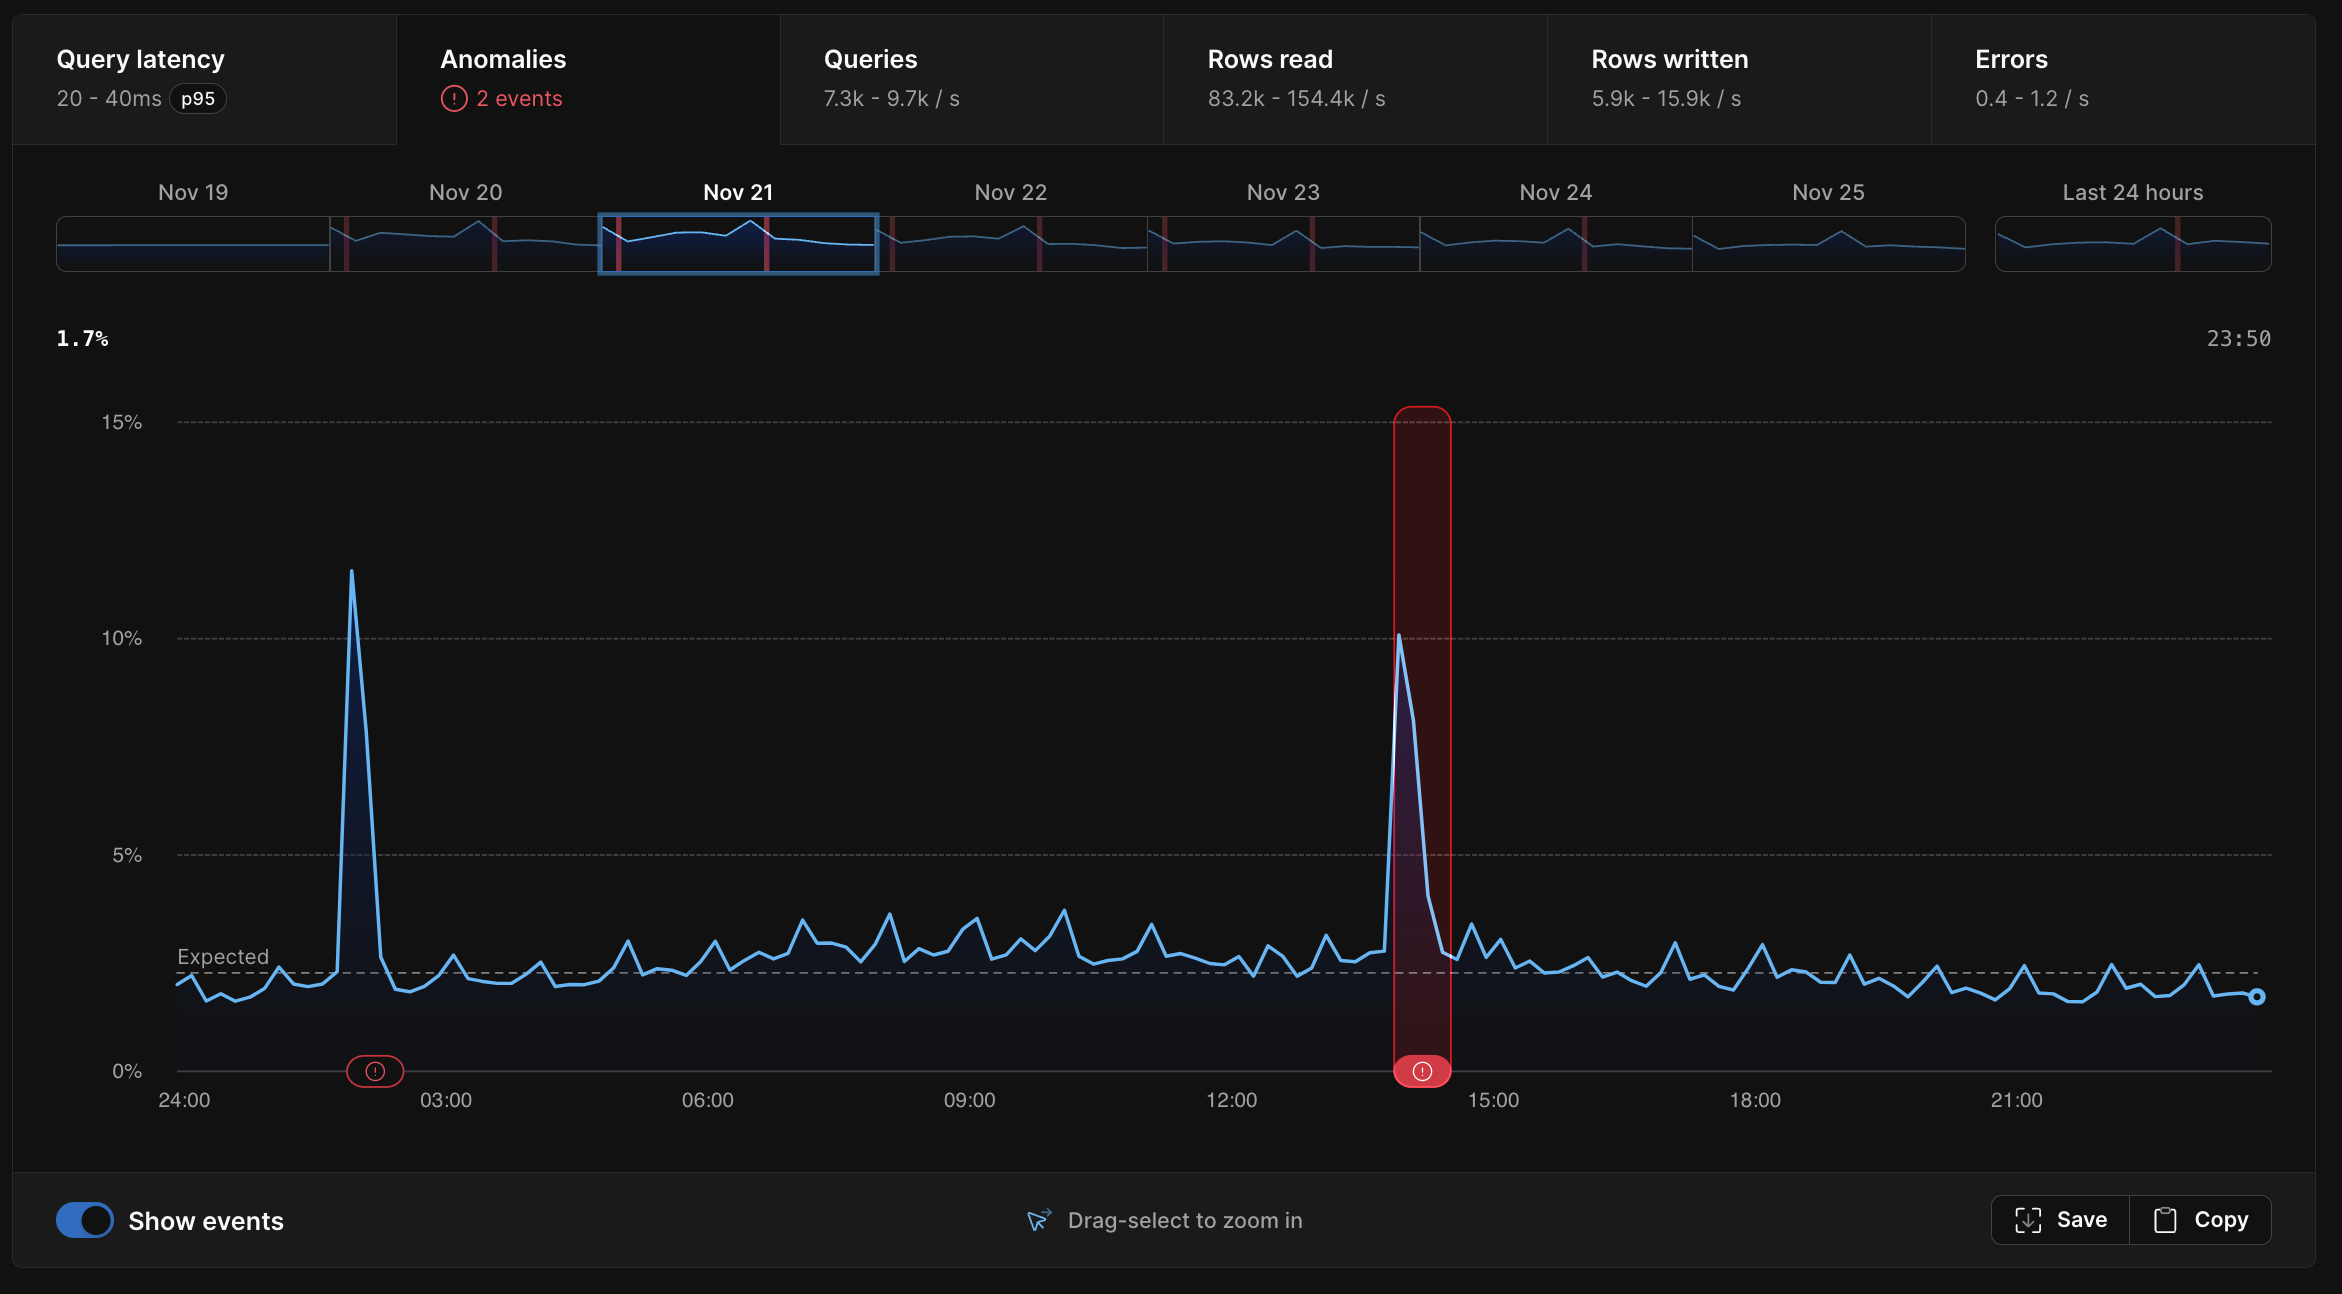
The graph shown under the Anomalies tab shows the percentage of queries executing slower than the 97.7th (2-sigma) percentile baseline on the y-axis and the period of time on the x-axis. The “expected” line shows the percent of queries that are statistically expected in a database with uniform query performance over time. Slight deviations from the expected value are normal. Only substantial and sustained deviations from the expected value are considered an anomaly.
- The query that triggered the anomaly
- CPU utilization
- Memory
- IOPS
- Queries per second
- Rows written per second
- Rows read per second
- Errors per second
Anomalies vs query latency
You may notice a correlation between some areas in the query latency graph and the anomalies graph. Conversely, in some cases, you may see a spike in query latency, but no corresponding anomaly. Increased query latency can be indicative of an anomaly, but not always. Query latency may increase and decrease in ways that don’t always indicate an actual problem with your database. For example, you may run a weekly report that consists of a few slow-running queries. These queries are always slow. Every week, you’ll see a spike on your query latency graph during the time that your weekly report is generated, but not on your anomaly violations graph. The queries are running at their expected latency, so this is not considered an anomaly.What should I do if my database has an anomaly?
The purpose of the Anomalies tab is to show you relevant information so you can determine what caused an anomaly and correct the issue. Let’s look at an example scenario. You deploy a feature in your application that contains a new query. This query is slow, running frequently, and is hogging database resources. This new slow query is running so often that it’s slowing down the rest of your database. Because your other queries are now running slower than expected, an anomaly is triggered. In this case, we will surface the new slow-running query so that you can find ways to optimize it to free up some of the resources it’s using. Adding an index will often solve the problem. You can test this by adding the index, creating a deploy request, and deploying it. If it’s successful, you’ll quickly see the anomaly end. On the other hand, an anomaly does not necessarily mean you need to take any action. One common example where you may see an anomaly is in the case of large active-running backups. In this case, we will tell you that a backup was running during the time of the anomaly.NoteEven if it causes an anomaly, we do not recommend you turn off backups to prevent possible data loss.

