Prerequisites
This document assumes we’ll be configuring a Prometheus 3.x instance via a configuration file running on our local machine. If you are using managed Prometheus via AWS, GCP or another provider, you will have to deploy Prometheus to scrape and forward metrics viaremote_write, as these services do not support scraping metrics.
Getting Started
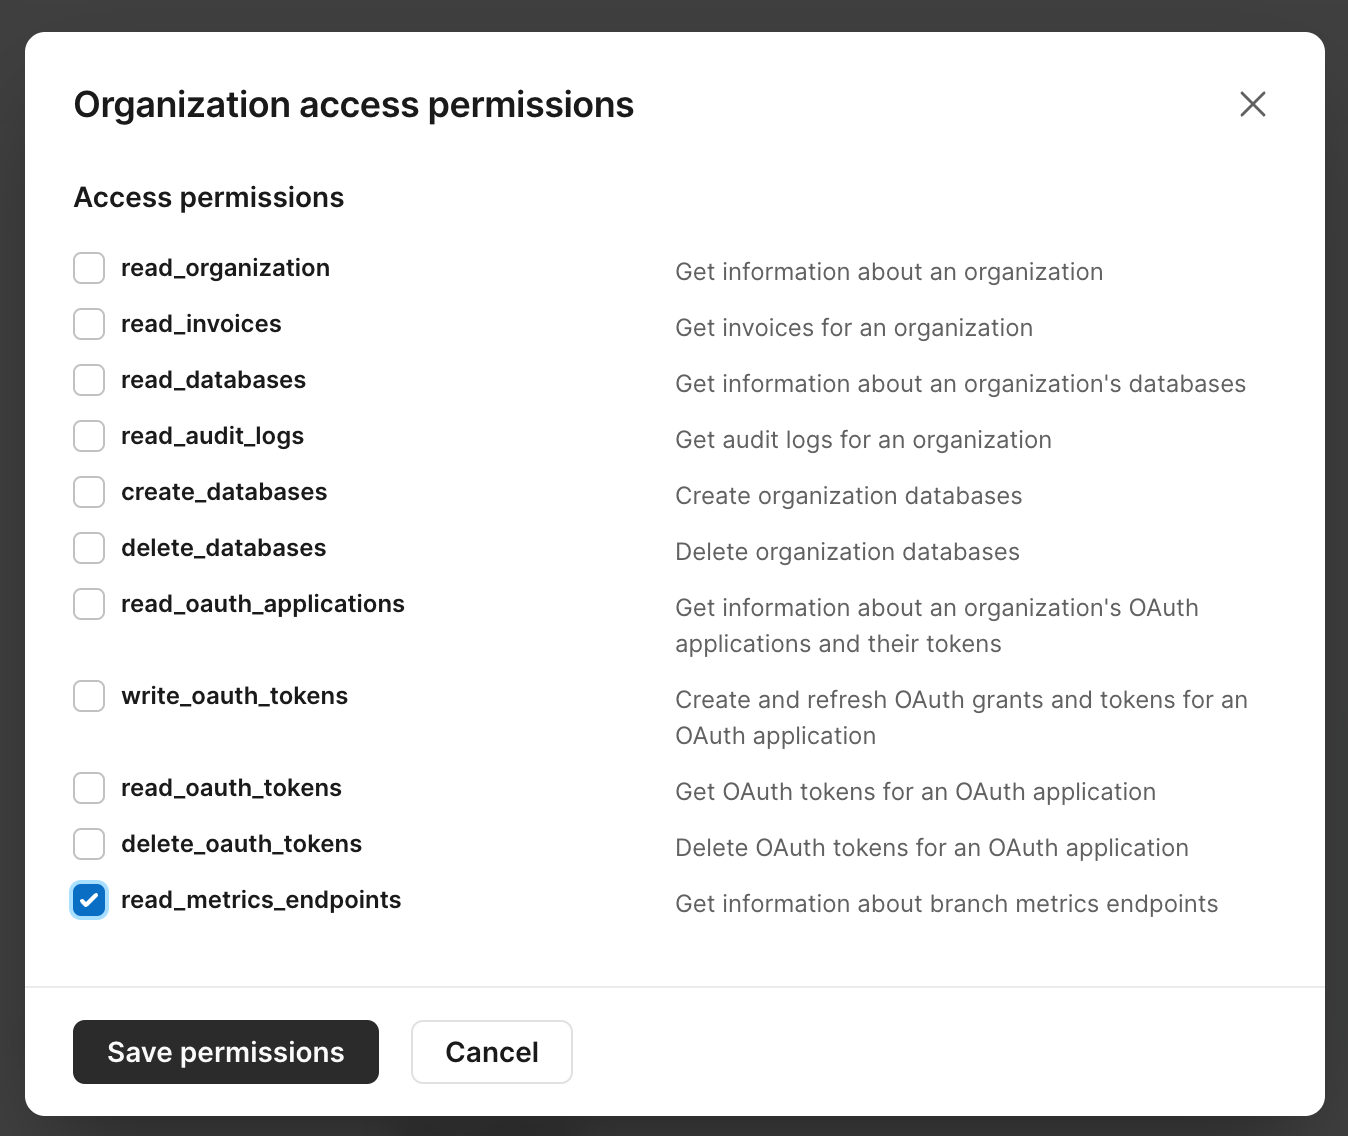
First, provision a new PlanetScale Service token in your Organization settings. Make sure to save the ID and token, as they will not be visible after they’ve been generated. When that’s created, grant the tokenread_metrics_endpoints permissions and click “Save permissions”. Your token should look like the following:
Configuring Prometheus
Now that we have a Service Token, we can add a scrape configuration for your PlanetScale organization. A minimal Prometheus configuration should look like the following:job_name and url, and place the Service Token and ID that we created in the previous step for the credentials.
Save this file to prometheus.yml in your working directory.
Start Prometheus
Run Prometheus pointed at this configuration file:0.0.0.0:9090, which means you can access it in your browser at http://127.0.0.1:9090.
Validating Service Discovery
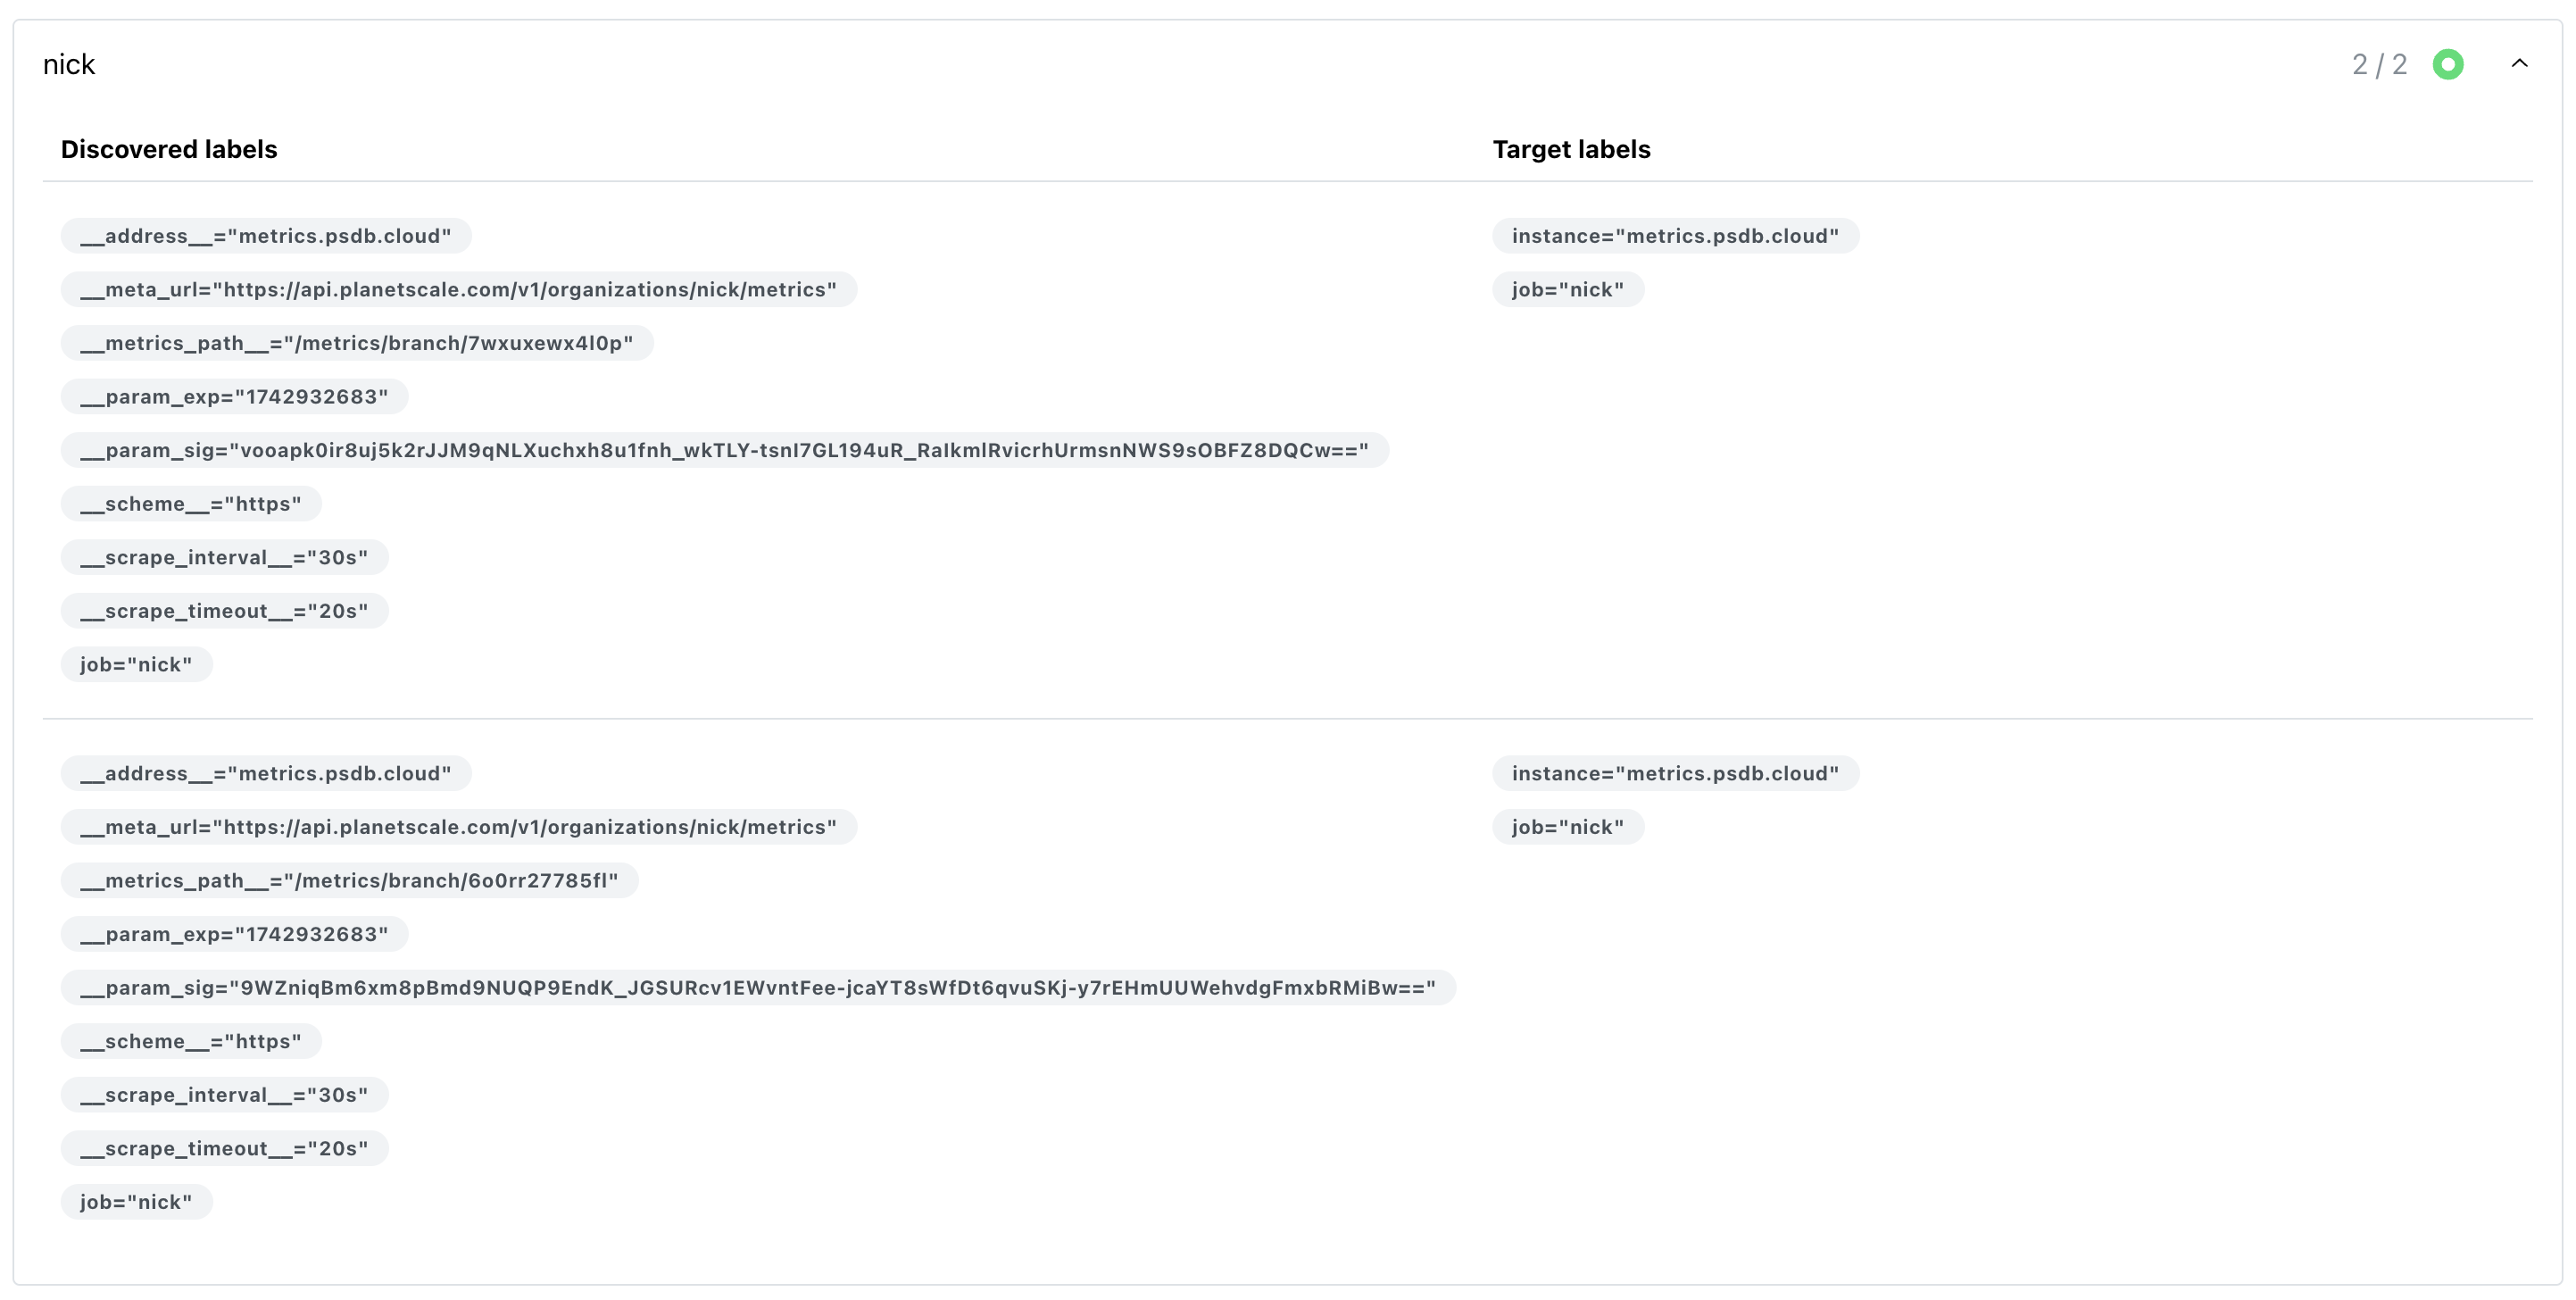
First, let’s make sure that Prometheus is properly querying the PlanetScale API for the right branches. If you go tohttp://127.0.0.1:9090/service-discovery you should see the job that we created earlier, with all of your branches listed under Discovered labels. In this example, our organization is called nick, so it looks like the following:
Querying Prometheus
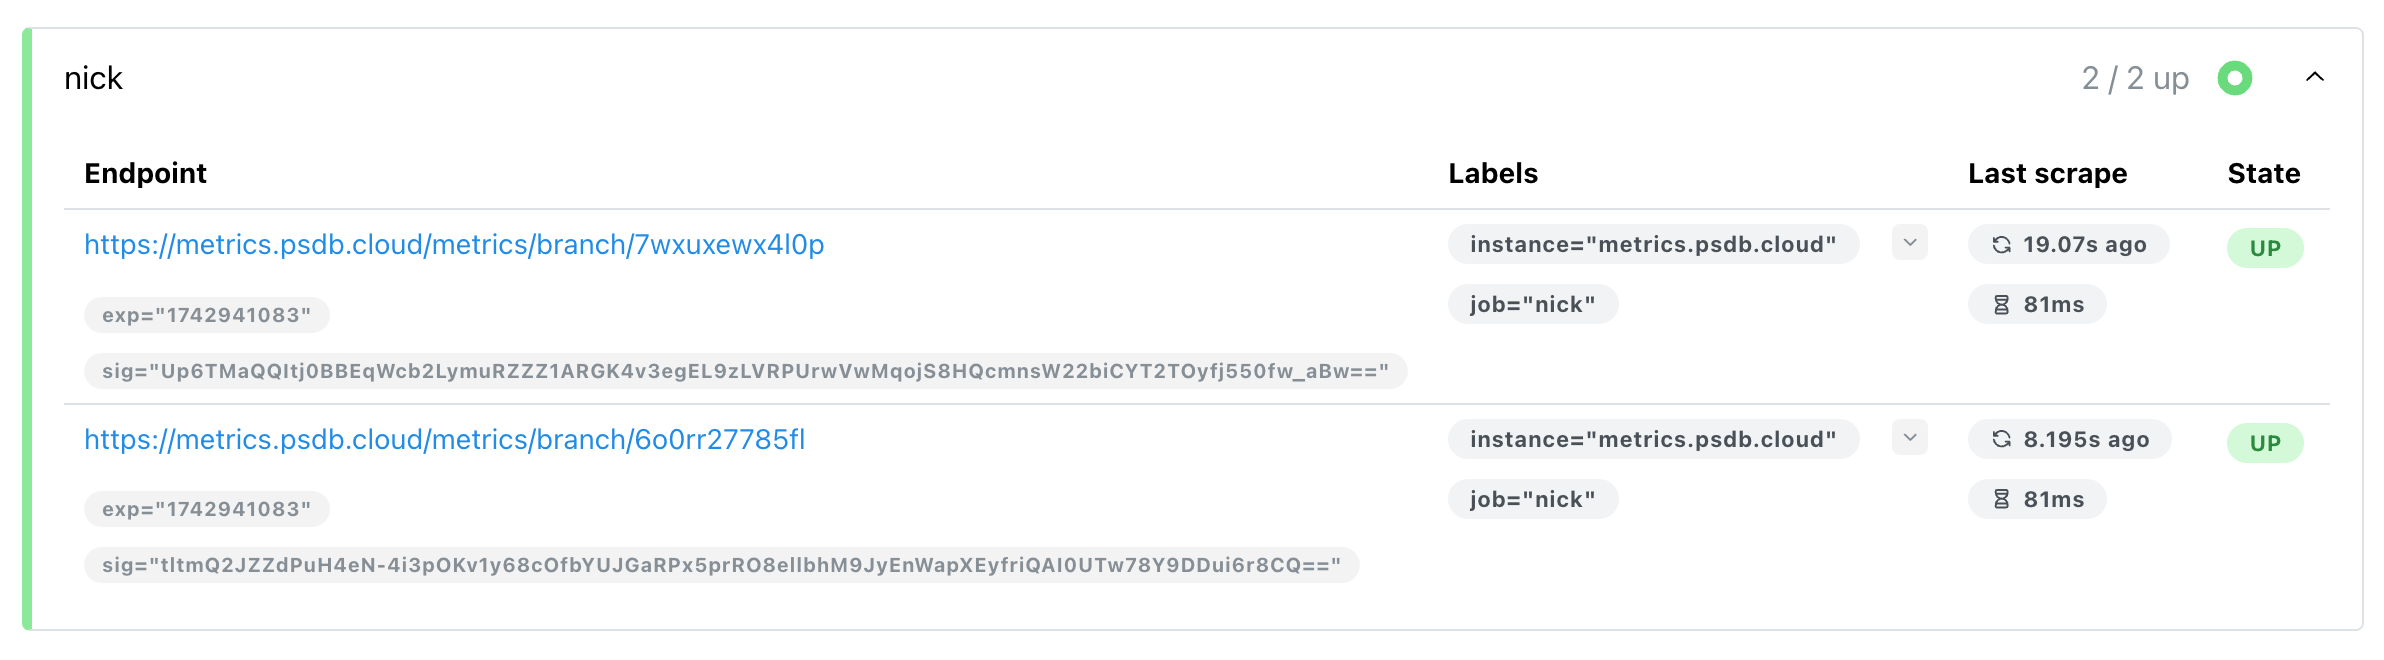
Now that we’re collecting metrics for my branches, our reference guide has a list of everything that we export. If I want to see how manyvtgate pods are running per AZ for my branch, I can query:

Next Steps
If you keep this Prometheus instance running, it will collect metrics every 30 seconds, and refresh the list of branches every 10 minutes. For more information, see:- Metrics reference for a list of metrics we expose
- Grafana and Prometheus tutorial for using PlanetScale’s provided dashboard to visualize these metrics in Grafana.
- Sending metrics to New Relic tutorial for using Prometheus to forward metrics to New Relic.